
How to Interpret CGM Data
How to Interpret CGM Data: A Complete Guide
Continuous Glucose Monitoring (CGM) systems have changed the way people manage diabetes by giving them instant glucose readings. However, it can be tough to understand CGM data if you're not familiar with the numbers and charts. In this article, we'll show you how to interpret CGM data, spot trends, and use this information to make better choices for managing your blood sugar levels
What is CGM Data?
CGM data includes the glucose readings that your CGM device captures, giving you valuable information on your blood sugar levels all day and night. Unlike old-school finger-prick tests, CGM keeps tabs on your glucose trends, patterns, and fluctuations 24/7. These readings are key to managing diabetes well.
Key Metrics in CGM Data
To make sense of CGM data, it's important to keep track of a few key factors:
- Time in Range (TIR): This tells you how much of the time your glucose levels are in the target zone. A high TIR is good for your health and helps lower the risk of complications.
- Glucose Variability: This just means how much your glucose levels go up and down over time. Keeping this variability low is key for stable glucose control and reducing the chances of highs and lows.
- Highs and Lows: Spotting periods of hyperglycemia and hypoglycemia can help you fine-tune your diet, medication, or exercise routine for better management.
Understanding these metrics gives you a better understanding of your overall glycemic trends and can guide you in taking proactive steps to maintain good health.
How to Read CGM Graphs and Reports
CGM devices provide valuable information through graphs and reports that show your glucose data. Here are some tips on how to interpret them:
- Daily Trends: Check daily graphs for any spikes or drops in glucose levels. Look for patterns related to your meals, activity, or sleep.
- Weekly Summaries: Take a step back and look at weekly summaries to see the bigger picture of your glucose patterns. This can help you identify consistent trends over time.
- AGP (Ambulatory Glucose Profile): AGP simplifies your data into a single report, making it easier to see and understand your glucose trends.
- By taking the time to understand and analyze your CGM graphs and reports, you'll gain valuable insights into how your body reacts to different factors. It's a great way to stay on top of your health and make informed decisions.
Identifying Patterns and Trends
Identifying Trends in CGM Data is Key to Better Glucose Management. For example-
- After-Meal Surges: If you notice a sudden spike in glucose levels after eating, it might be time to tweak your diet a bit.
- Nighttime Dips: Seeing a significant drop in blood sugar while you sleep could signal the need for adjustments to your meds or nighttime snacks.
Understanding these patterns can help you tailor your routine and keep your glucose in check more efficiently.
Common Challenges in CGM Data Interpretation
Although CGM devices are quite sophisticated, users may encounter some obstacles:
- Sensor Errors: At times, calibration inaccuracies can result in incorrect data.
- Outliers: Unforeseen readings may arise due to activities like exercise or stress.
If you come across any complications, don't hesitate to seek help from a healthcare professional to better grasp the CGM data challenges
Practical Tips for Effective CGM Data Interpretation
To make the most of CGM, try these CGM interpretation tips:
- Track Your Activities: Log your meals, exercise, and medications to see how they affect your glucose levels.
- Set Achievable Goals: Use CGM data to set realistic glucose targets that you can reach.
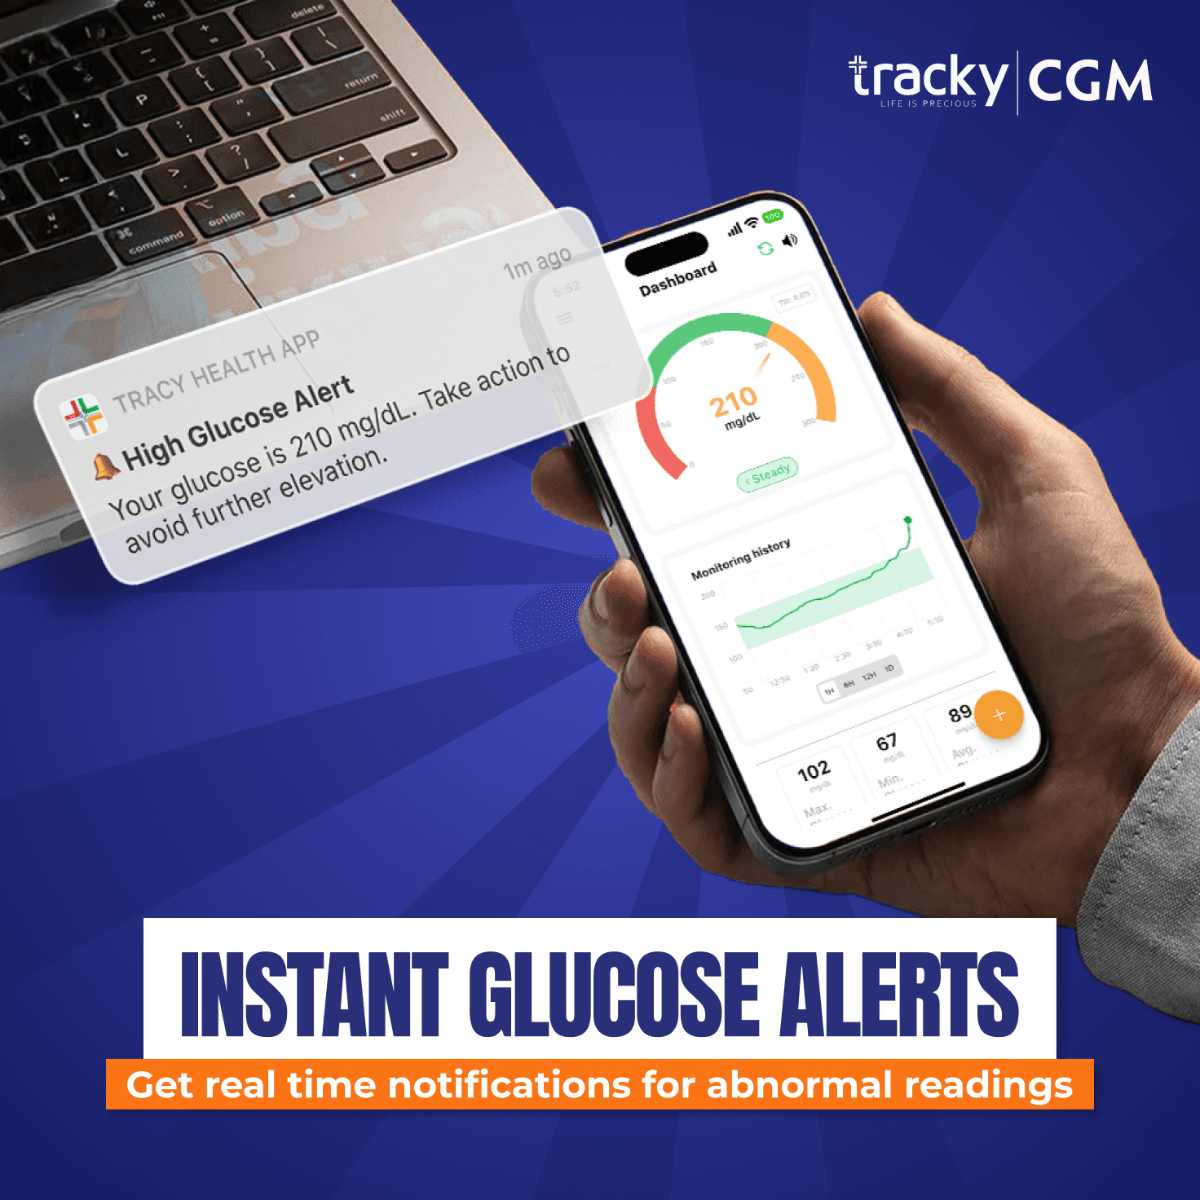
- Stay Alert: Utilize CGM alarms to quickly respond to any unexpected spikes or drops in your levels.
By following these suggestions, you'll become a pro at understanding CGM data and using it to your advantage.
Benefits of Understanding CGM Data
Interpreting CGM data accurately has so many perks:
- Better control of your blood sugar levels.
- Lower chances of diabetes-related issues.
- Feel more confident in your lifestyle and treatment choices.
You can use CGM data interpretation to improve your overall health.
When to Seek Professional Guidance
If you have any doubts about your CGM readings or keep seeing inconsistent results, don't hesitate to reach out for help. Endocrinologists and diabetes educators are here to offer tailored guidance drawn from your data, helping you effectively control your glucose levels.
Conclusion
Understanding CGM data is crucial for all CGM device users. By grasping important measurements like Time in Range (TIR), glucose variability, and high/low patterns, you can proactively manage your health. This guide will help you enhance your knowledge of CGM readings, and don't forget to seek guidance from your healthcare provider for extra assistance.
Start taking charge of your diabetes management now and empower yourself with your CGM data for a brighter, healthier future.
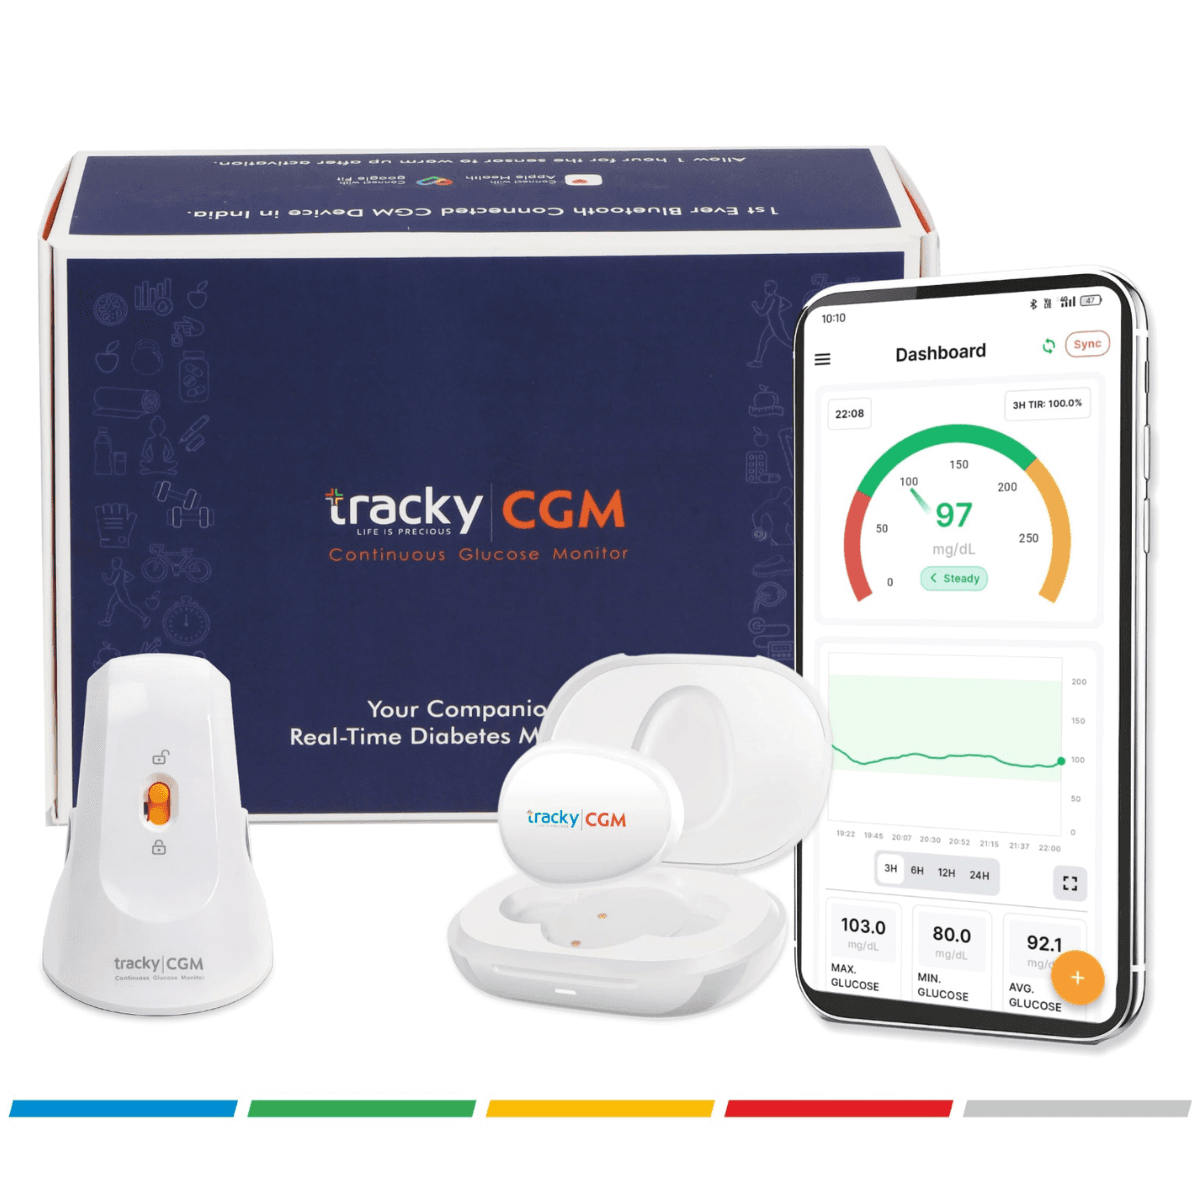
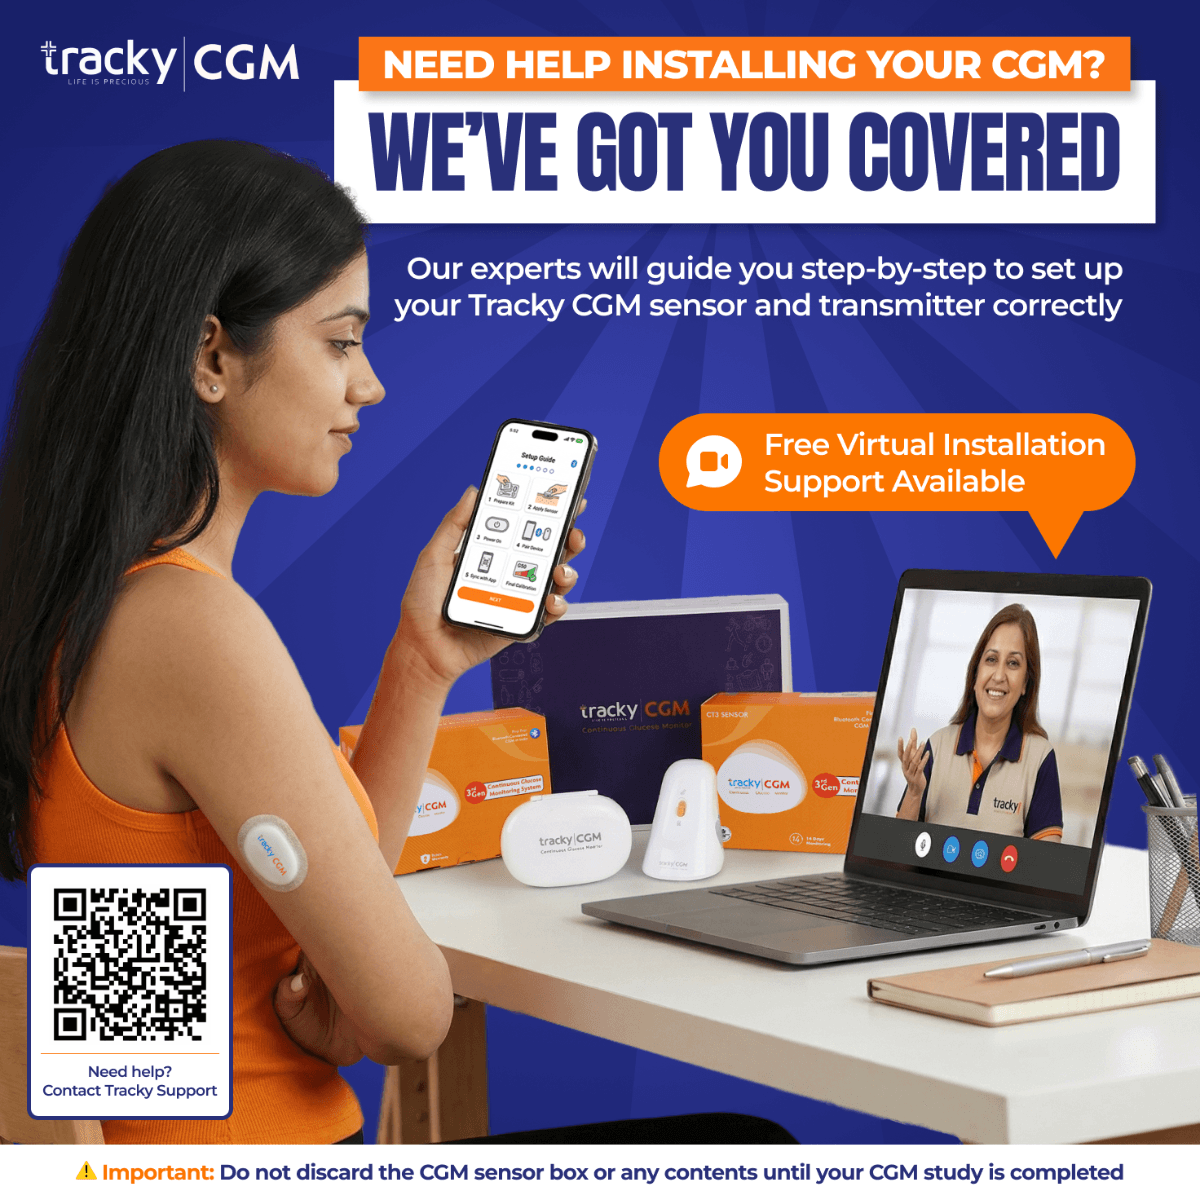
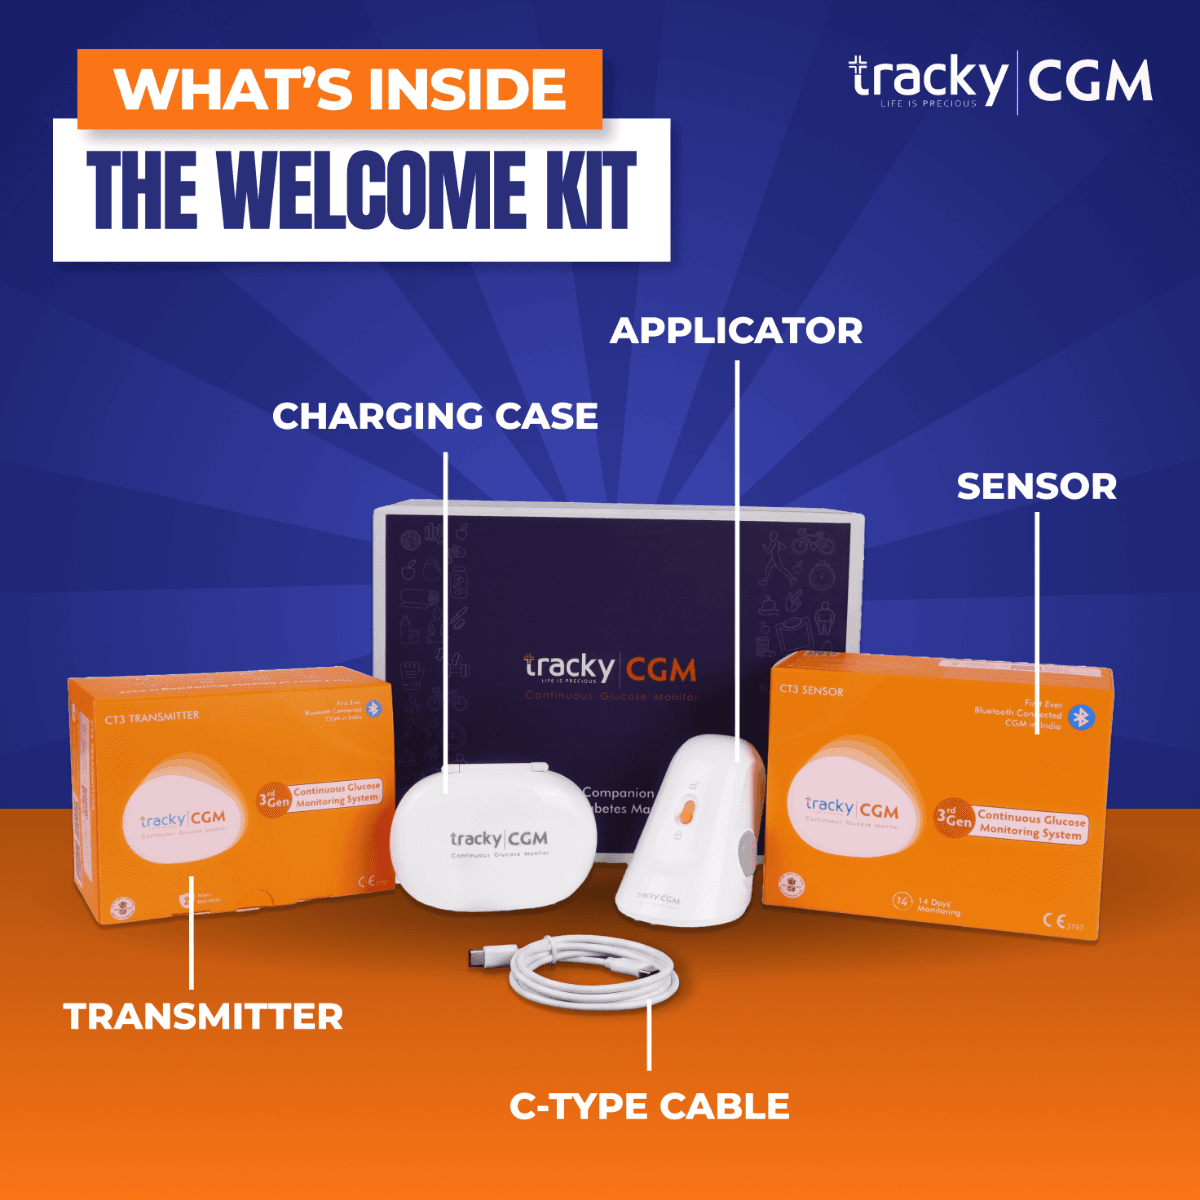
Tracky CGM - Welcome kit
Understand the Core Elements of Tracky CGM
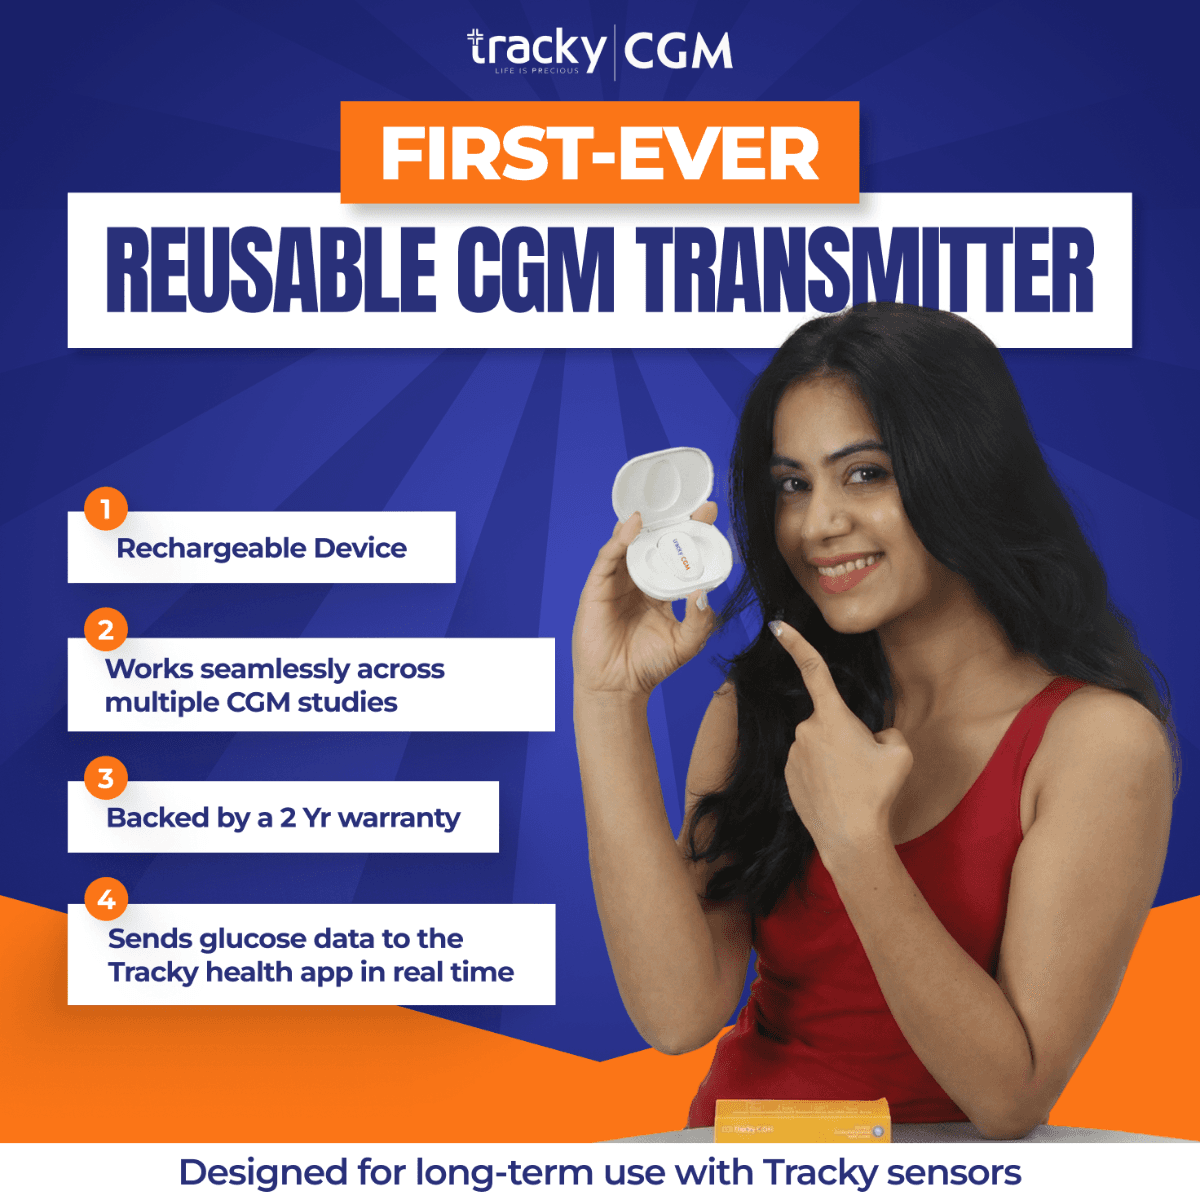
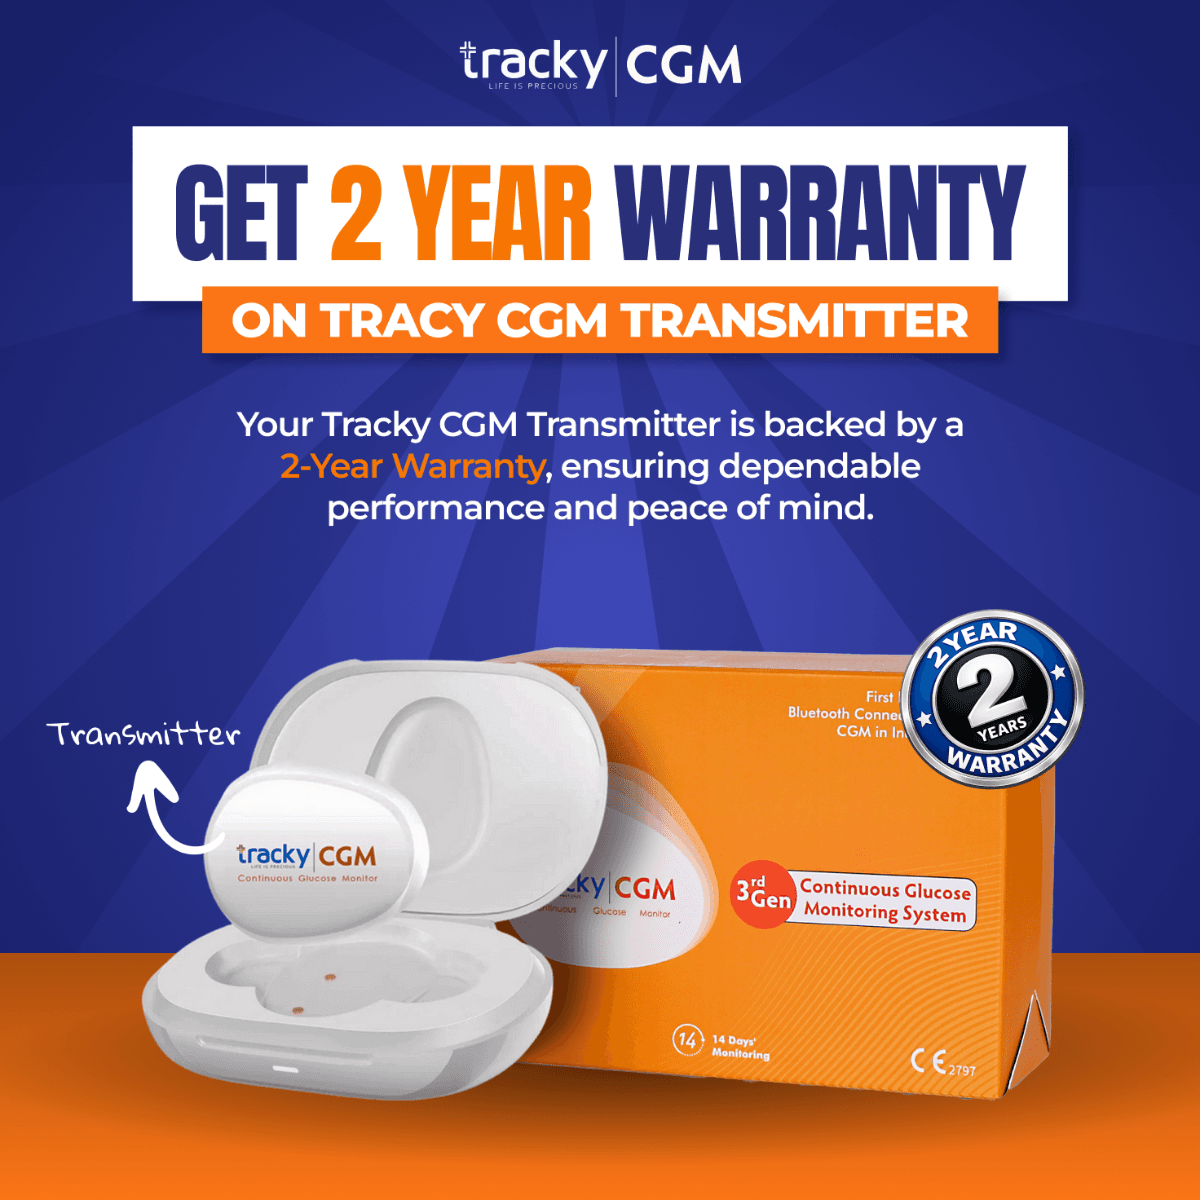
Transmitter
- Rechargeable with a warranty of 2 years.
- Single charge for 14 days.
- Fast charging
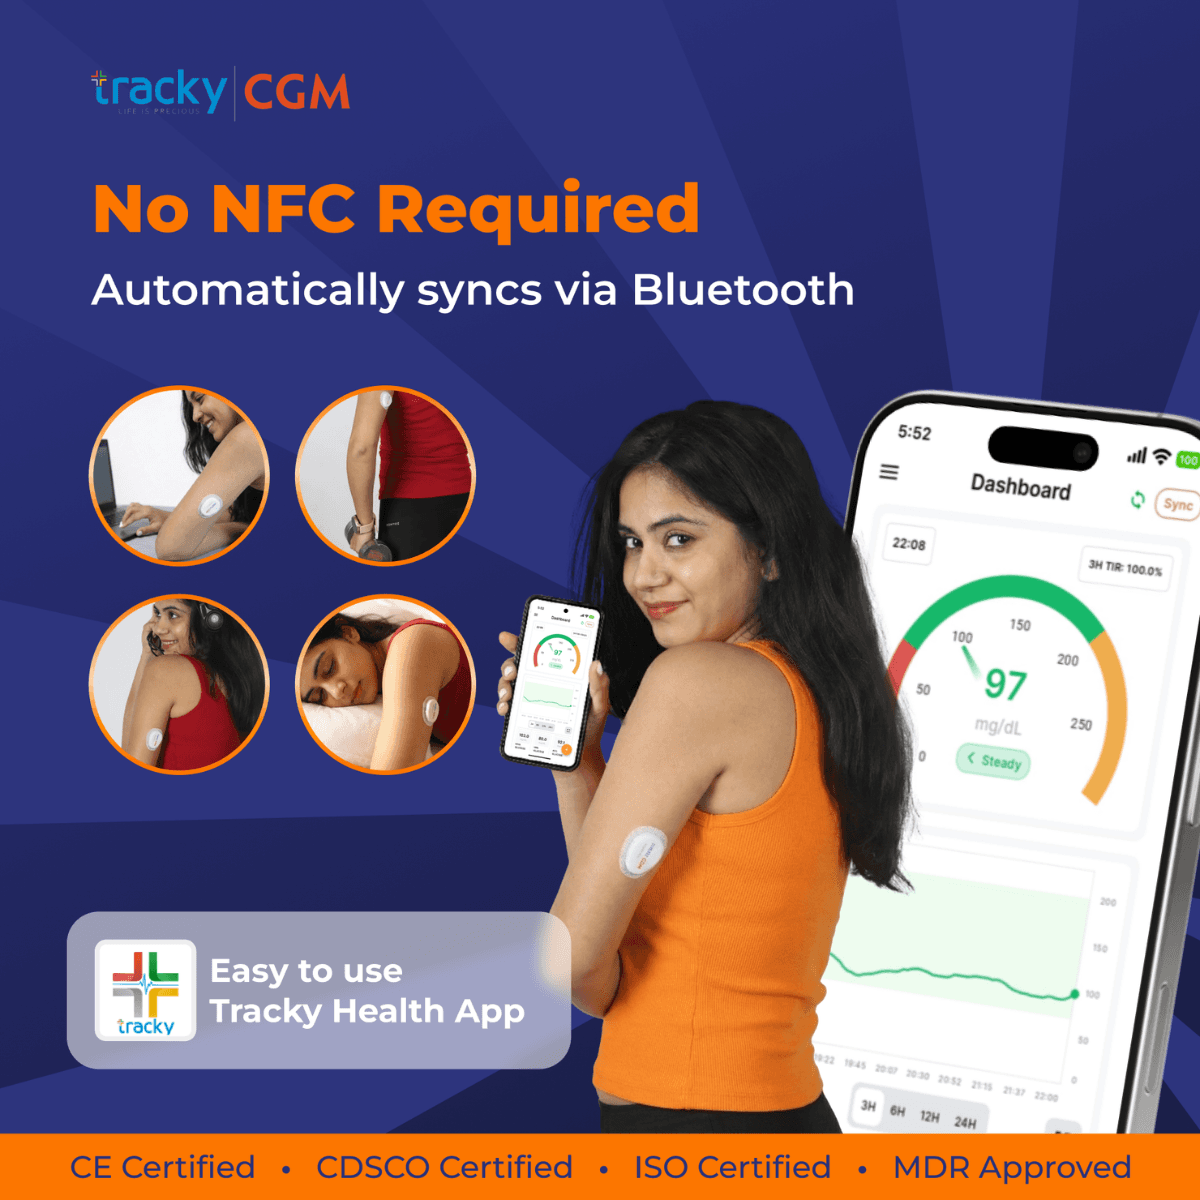
- Bluetooth range of 6 meters for real-time data transmission.
- Compact, lightweight, waterproof, and dustproof.
- No calibration required.

Sensor
- Ergonomically designed for painless implantation.
- Comes with a safety lock for secure handling
- Provides continuous glucose monitoring for 14 days.
- Capable of measuring glucose levels within a range of 30.63 - 500 mg/dl
- Shelf life of 1 year.

Let’s Get Started
Knowledge hub for Tracky CGM
Tracky CGM is a state-of-the-art technology designed to revolutionize diabetes management. It provides real-time readings every 3 minutes of blood glucose levels throughout the day and night, ensuring continuous monitoring. These advanced devices empower individuals with diabetes by delivering detailed and actionable data to guide treatment decisions, helping to achieve better health outcomes.


Download the Tracky Heath App from the links below


